
Charts
Gross Value Added (GVA) By Registered Factories
Aditya Shankar M
30 October 2026
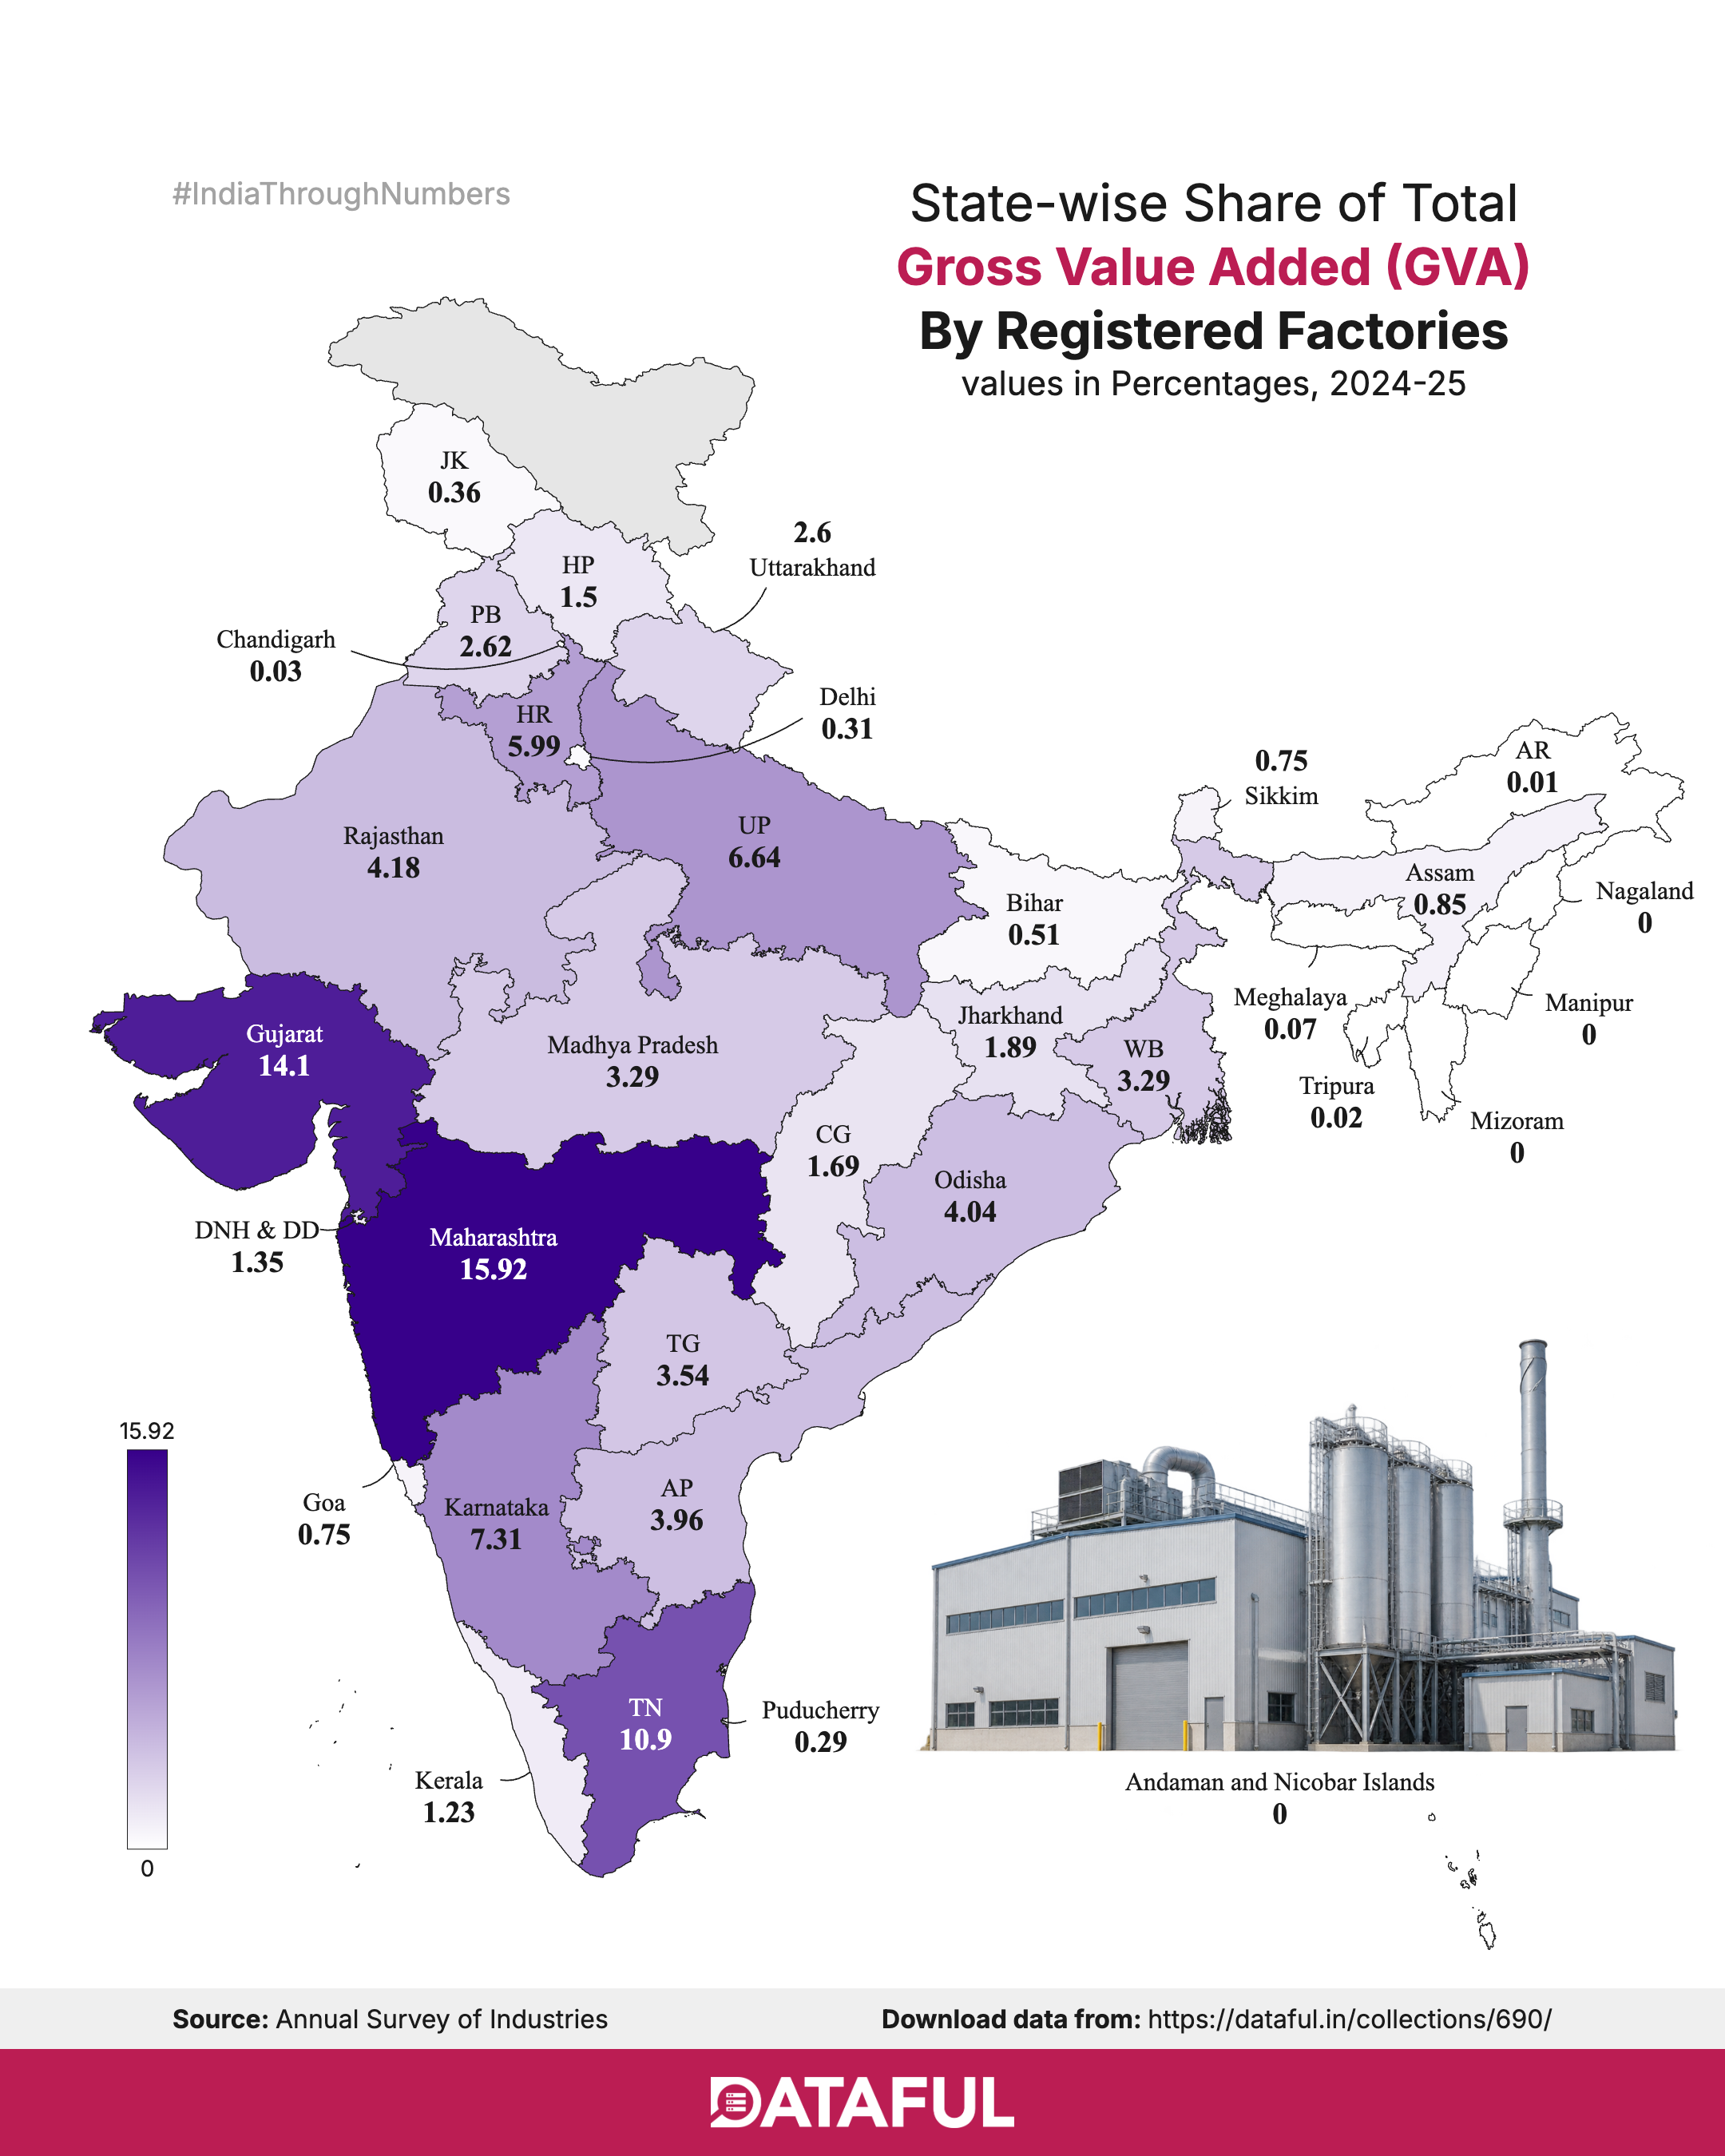
India’s Manufacturing Footprint: Who holds the biggest share? 🏭🇮🇳
Data from the Annual Survey of Industries (2024-25) reveals a significant concentration in the State-wise Share of Total Gross Value Added (GVA) by registered factories across India.
Here are the key takeaways from the map:
📊 The Western Powerhouses Lead the Pack
Maharashtra (15.92%) and Gujarat (14.1%) together account for 30% of India's total factory GVA, cementing their role as the nation's primary industrial powerhouses.
📍 Southern Manufacturing Strength
Tamil Nadu leads the South with 10.9%, followed by Karnataka (7.31%), Andhra Pradesh (3.96%), and Telangana (3.54%).
🏭 Northern & Eastern Highlights
In the North, Uttar Pradesh (6.64%) and Haryana (5.99%) lead regional industrial output.
Odisha (4.04%) and West Bengal (3.29%) anchor factory production in the East.
💡 Key Takeaway: The industrial backbone remains heavily clustered along western and southern coastal trade hubs, highlighting the ongoing geographical disparity in factory infrastructure and manufacturing growth across states.
District Crimes (a new product of Dataful)
District Crimes turns NCRB's Crime in India reports into 15 clean, district-wise datasets covering 700+ districts, with data as far back as 2001.

