
Articles
India’s 2026 Monsoon 13% Below Normal; Southern Reservoirs 43% Below Average
Sai Krishna Muthyanolla
26 October 2026
TL;DR: India received 759.4 mm of rainfall during the June–September 2026 monsoon, 12.6% below its long-period average. East and Northeast India recorded their lowest seasonal rainfall since 1901, while the South Peninsula received 24% less rain than normal. Although extremely heavy rainfall events rebounded to 388, southern reservoirs held 24.76 BCM against a ten-year average of 43.33 BCM. Historical records show repeated drought declarations in districts such as Ananthapuramu in Andhra Pradesh, while post-monsoon soil moisture remains below average in several states. Together, these indicators reveal an uneven monsoon impact and highlight areas requiring closer monitoring.
Context
India’s monsoon tells two stories this year. The country received 12.6% less rainfall than normal between June and September 2026, but the shortfall was far from uniform. Eastern and northeastern India received 26% less rain than average, while the southern peninsula recorded a 24% deficit.
The season began on a difficult note, with June rainfall nearly 40% below normal. July brought a brief recovery, with rainfall slightly above average, but the deficit returned in August and September. The rebound, in other words, did not erase the shortfall.
What does this mean for the land and the people who depend on the rain? The IMD had warned of a below-normal monsoon in May, when El Niño conditions were expected to develop. But the national rainfall deficit is only the starting point. To understand where drought risks are emerging, it is necessary to look beyond how much rain fell to where it fell, how long the dry spells lasted, and how much moisture remained in the soil.
Who compiles this data?
The India Meteorological Department (IMD) publishes rainfall data and monsoon forecasts, while the Mahalanobis National Crop Forecast Centre (NCFC) monitors agricultural conditions using rainfall, soil moisture and satellite indicators. The India Drought Monitor, developed by IIT Gandhinagar’s Water and Climate Lab, tracks drought conditions using meteorological and satellite data.
Where can I download clean & structured data related to this?
Clean, structured datasets related to Indian rainfall, drought conditions, agriculture and water resources are available on Dataful.
Key Insights
India’s 2026 monsoon ranks among the weakest in decades, with sharp regional deficits
India received 759.4 mm of rainfall during the June–September 2026 southwest monsoon, just 87% of its long-period average (LPA). According to the IMD, this was the country’s fourth-lowest monsoon rainfall since 2001 and 13th-lowest since 1901. The national shortfall, however, conceals sharper regional deficits.
East and Northeast India received 1,016.3 mm, or 74% of its regional LPA, making it the lowest seasonal rainfall for the region since 1901. The South Peninsula received 542 mm, or 76% of its LPA, ranking fourth-lowest since 1901 and second-lowest since 2001. Northwest India received 94.1% of its LPA, while Central India recorded 97%, within the normal range.
The shortfall also affected the monsoon core zone, which includes much of India’s rain-fed agricultural area. It received 779.9 mm, which is below the lower limit of the normal category (782.8 to 881.2). Across India’s 36 meteorological subdivisions, 17 (42% of the area) recorded deficient rainfall, 18 (53%) received normal rainfall, and one, in Odisha (5%), recorded excess rainfall. At the district level, 282 of 741 meteorological districts (38% of total area) recorded below-normal rainfall, while 34 (5% of total area) received significantly below-normal rainfall. Another 312 districts (42% of total area) recorded normal rainfall, 90 (12% of total area) received excess rainfall, and 16 (2% of total area) recorded substantially above-normal rainfall.
Extremely heavy rainfall events rebound in 2026, driven by a July spike
The India Meteorological Department (IMD) classifies rainfall of 115.6–204.4 mm in 24 hours as very heavy and rainfall exceeding 204.4 mm as extremely heavy. During the June–September 2026 monsoon, India recorded 1,765 very heavy rainfall events and 388 extremely heavy events. Extremely heavy events rose from 296 in 2022 to 426 in 2023 and peaked at 473 in 2024, before declining to 303 in 2025 and increasing again in 2026. Very heavy rainfall events followed a different trend, rising from 1,875 in 2022 to a peak of 2,632 in 2024, before falling to 2,109 in 2025 and 1,765 in 2026. July 2026 alone recorded 269 extremely heavy events, the highest July count in since 2022, compared with 84 in 2025. These figures show that although the overall frequency of very heavy rainfall has declined since 2024, extremely heavy events rebounded in 2026.
Historical El Niño years show a recurring concern, but widely varying rainfall outcomes
Historical data in the IMD’s El Niño table show why the phenomenon matters when assessing India’s 2026 monsoon, but also why it cannot explain the season’s outcome on its own. Of the 17 El Niño years listed between 1951 and 2023, 12 recorded below-normal June–September rainfall, including seven with deficits exceeding 10%. Yet outcomes varied considerably: rainfall was 22.3% below normal in 1972 and 20.9% below normal in 2002, while 1994 recorded a 13.9% surplus and 1997 ended almost exactly at normal, despite being the only Strong El Niño among all.
Monthly figures reveal another important distinction. In 2002, July rainfall was 50.6% below normal, contributing to a seasonal deficit of 20.9%. In 2023, above-normal rainfall in July and September partly offset August’s 36.1% shortfall, leaving the season 5.3% below normal. A seasonal total can therefore conceal sharp monthly swings, just as a national average can mask regional rainfall deficits.
That distinction is relevant to the 2026 monsoon. India received 759.4 mm of rainfall, or 87% of its long-period average, with particularly large deficits in East and Northeast India and the South Peninsula. IMD reported that El Niño strengthened during the season, but the historical comparisons do not establish how much it contributed to this year’s shortfall. Nor does deficient seasonal rainfall alone establish the severity of agricultural drought.
Southern reservoirs fall to less than half their year-ago levels
The clearest concentration of pressure appears in the reservoir data. On 15 October, CWC’s 178 monitored reservoirs nationally held 68.58% of their live-storage capacity. Their storage was 16.44% below the corresponding ten-year average. Of the 178 reservoirs monitored by the Central Water Commission, on 15 October 2026, 105 held more than 80% of their ten-year average storage, while 73 were at or below that level. Of the latter, 31 had storage at or below 50% of normal.
The shortfall was concentrated in the South. Its 50 monitored reservoirs held 24.76 BCM, against a ten-year normal of 43.33 BCM, a deficit of 18.57 BCM. This accounts for approximately 74.5% of the net national storage shortfall of 24.93 BCM, including the effect of a small surplus in Central India.
State-level departures varied considerably. Storage was 61.50% below normal in Tamil Nadu, 59.33% in Andhra Pradesh and 51.63% in Telangana. Karnataka was 32.28% below normal, while Kerala was 17.67% below. These figures indicate a weaker reservoir position, but do not translate directly into equivalent reductions in water available to every user. Actual supply depends on the reservoirs serving an area, existing commitments, alternative sources and distribution systems.
The timing is also important. Tamil Nadu receives a substantial share of its rainfall during the October–December northeast monsoon, making subsequent rainfall and reservoir inflows important to watch. The 15 October 2026 figures are therefore a snapshot, not a final assessment of water availability for the coming months. Even so, the regional imbalance is clear: the national storage figure masks the depth of the shortfall in southern India.
District data show where rainfall deficiency meets underlying drought vulnerability
It is also important to look at districts apart from broad regions. IMD’s seasonal rainfall distribution records 282 districts with deficient rainfall and 34 with large-deficient rainfall. Together, that is 316 districts, or approximately 42.6% of the 741 districts listed. Further, 312 districts are recorded in the normal category, 90 with excess rainfall and 16 with large-excess rainfall. The distribution confirms that the deficient season was far from uniform. It also needs to be interpreted precisely: a rainfall-deficient district is not automatically a district officially declared drought-hit.
The agriculture ministry’s Crisis Management Plan (CMP) for drought provides a list of districts where state governments declared drought from 2011-12 to 2025-26. It has 472 districts declared drought over the years, and such declarations peaked in 2015-16 with 294 districts declared drought-affected, and in recent years, it declined: 71 in 2023-24 (Karnataka 31, Maharashtra 15, Rajasthan 12, Andhra Pradesh 13), and only 5 in 2024-25 and 4 in 2025-26, all in Andhra Pradesh. Ananthapuramu was declared drought-affected in 11 years, followed by Barmer, Jaisalmer, Bellari and 14 other districts with declarations in 10 years each.
A separate 2024 district risk assessment by the Department of Science and Technology identifies underlying vulnerability. It places 91 districts in the very high drought-risk category and 188 in the high category, 279 districts in total. More than 90% of districts in the Very High category (83 out of 91) are located in Bihar, Assam, Jharkhand, Odisha, Uttar Pradesh, and Maharashtra. These classifications combine hazard, exposure and vulnerability. They identify relative structural risk, rather than establishing that all these districts experience drought. The left image provides the Drought exposure Map, while the right image shows the current drought conditions as on 21st October, 2026, according to the India Drought Monitor.
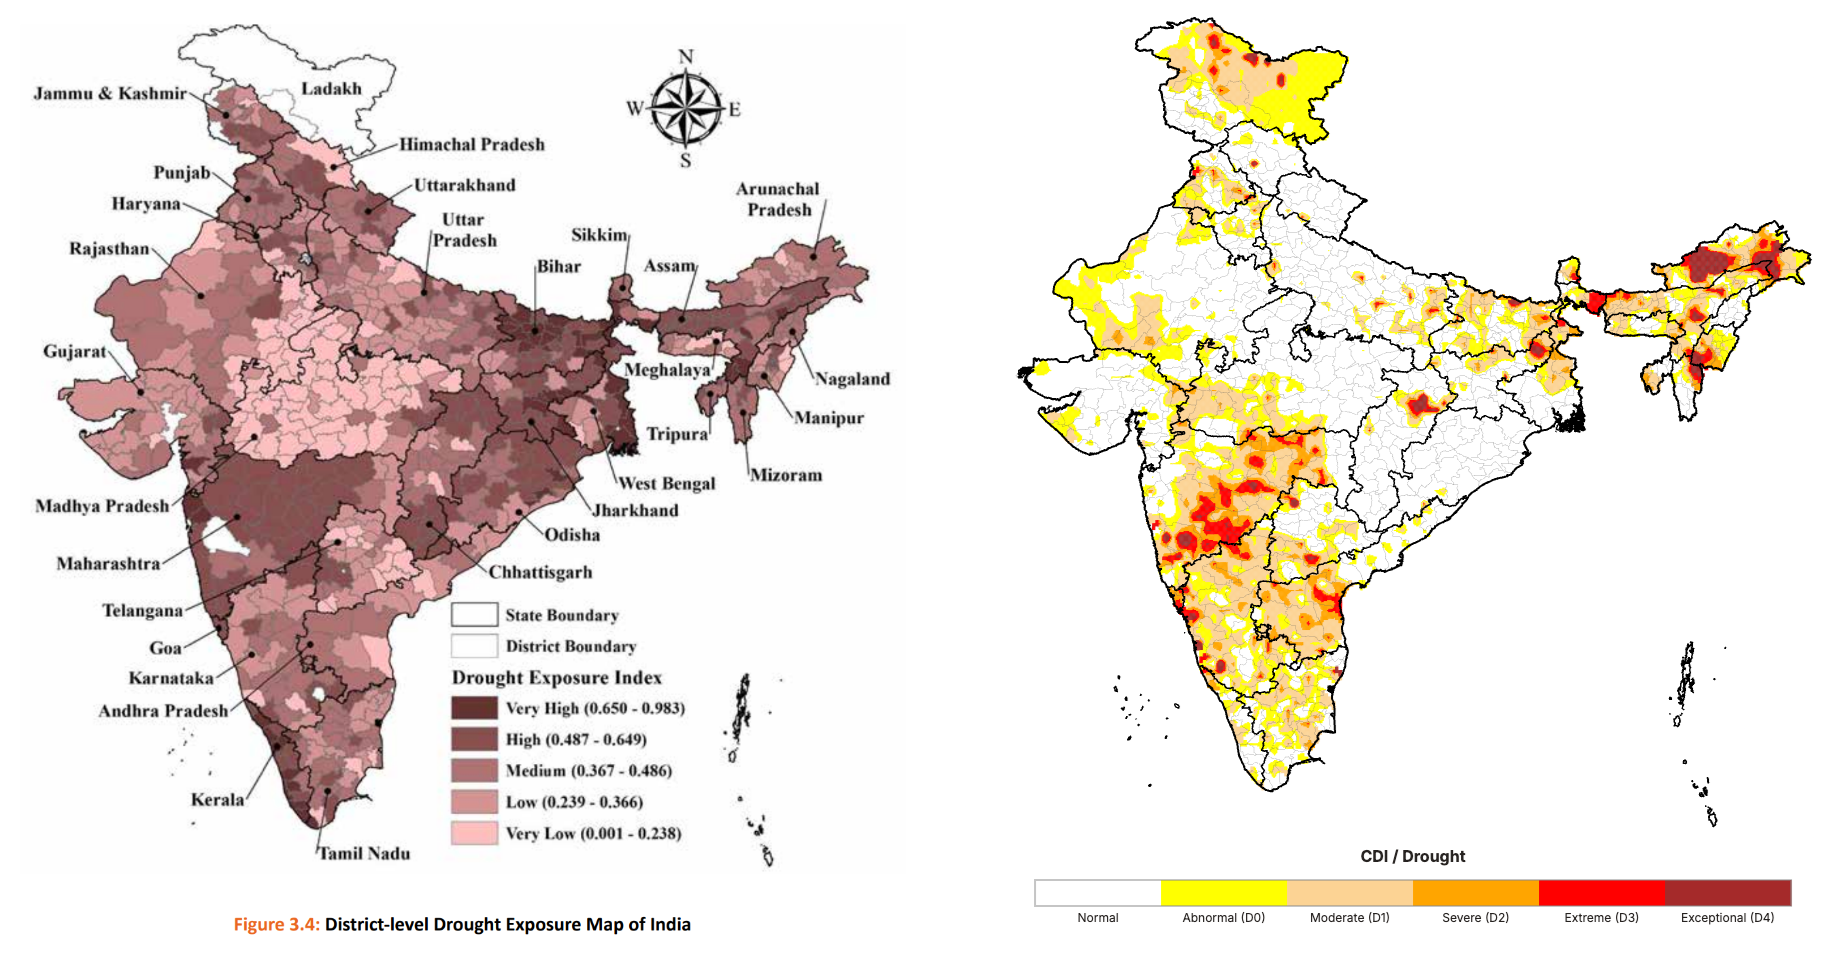
Root-Zone Soil Moisture overlaps with low reservoir storage levels in Southern India
The NCFC’s report dated 19 October 2026 provides a more recent indicator of agricultural conditions. It compares root-zone soil moisture for 8–14 October with the average for the previous ten years.
The report finds that root-zone soil moisture was similar to or better than the ten-year average in parts of Chhattisgarh, Odisha, Jharkhand, Uttar Pradesh, eastern and northern Madhya Pradesh, Uttarakhand, Jammu and Kashmir, and Ladakh. In contrast, soil moisture was below the ten-year average in Karnataka, Maharashtra, Andhra Pradesh, Telangana, Tamil Nadu, Rajasthan, Gujarat, western Madhya Pradesh, Bihar, West Bengal and the Northeast region.
The comparison suggests that the effects of the monsoon deficit were not uniform across the country and that some areas entered the post-monsoon period with less soil moisture than their historical average. For agriculture, root-zone moisture is particularly relevant because it reflects water availability in the soil where plant roots draw moisture.
The overlap between below-average soil moisture and low reservoir storage in parts of southern India warrants particular attention. At the same time, soil moisture at or above the historical average in parts of eastern and central India shows why a national rainfall deficit cannot be used as a proxy for conditions in every district.
The coming weeks will bring further evidence about how these conditions develop. In Tamil Nadu, the northeast monsoon and associated reservoir inflows will be especially relevant. Elsewhere, changes in soil moisture and water storage will help clarify whether the seasonal rainfall deficit translates into continuing agricultural or water-supply pressure.

Why does it matter?
A national rainfall deficit reveals little about whether a farmer’s soil holds enough moisture or a household can count on its water supply. In 2026, 316 of 741 meteorological districts recorded deficient or large-deficient rainfall, while southern reservoirs held substantially less water than their ten-year average. The NCFC also reported below-average root-zone soil moisture across several states in October 2026. Together, these indicators point to pressure on water availability, although local supplies depend on reservoir storage, existing commitments, alternative sources and distribution systems. Subsequent rainfall and reservoir replenishment will be particularly important for Tamil Nadu during its northeast monsoon season. Historical drought declarations and district-level risk assessments add another layer, helping distinguish the current rainfall shortfall from recurring drought exposure.
Key Numbers
13% below average: India received 759.4 mm of southwest monsoon rainfall in 2026, against a long-period average of 868.6 mm.
388 extremely heavy rainfall events: Up from 303 in 2025, an increase of approximately 28%, despite the deficient season.
316 of 741 districts: Recorded deficient or large-deficient seasonal rainfall, accounting for approximately 42.6% of the districts listed.
42.85% below average: Southern India’s monitored reservoirs held 24.760 BCM on 15 October, against a corresponding ten-year average of 43.327 BCM.
Trusted by 60,000+ registered users
With over 17,500+ clean, standardized datasets across 50+ sectors, Dataful makes it easy for researchers, analysts, and curious minds to explore official data without the hassle.

